We at Bring have been using c3p0 in several of our applications, over the past years. Recently we faced an issue where we started to see lots of CannotGetJdbcConnectionException errors. The underlying database is MySQL for reference.
We thought that the issues were related to a migration to a new data center at first, but we ruled that out once we checked out that there were not enough slow queries to back this claim.
Read Connection Pooling with c3p0 →
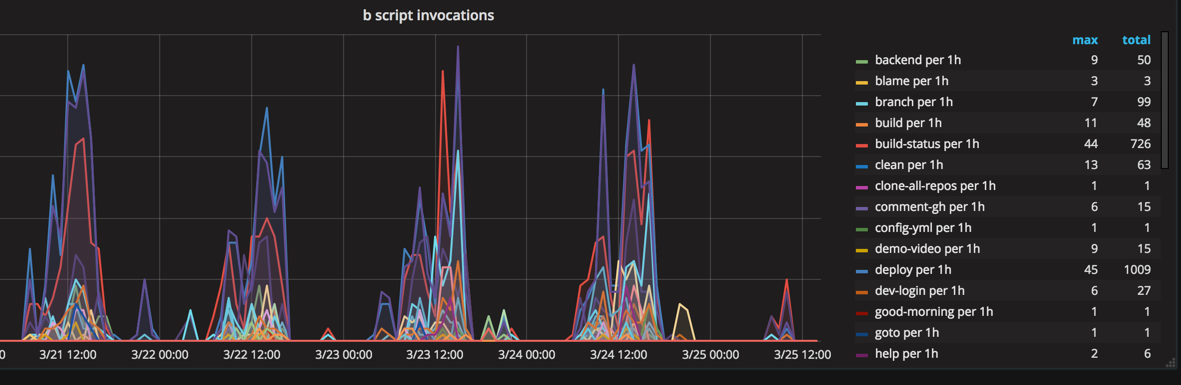
In the web team we have a suite of scripts, that we call the b-scripts. This is a collection of scripts that automate some common tasks. Because of our faith in automation, this collection of scripts keeps growing over time and we thought it would be fun to review some of them. We can already reveal that the most difficult part of any of the scripts has been to setup good auto-completion, but it has been well worth the effort. All of our scripts are sub commands to the b command. The b command sets up some environment variables, metrics support, help, and auto-completion for the other commands.
Read b-scripts →
As mentioned in our previous blog, We at bring, use influx and grafana extensively, as one of the monitoring tools to collect statistics and visualize different aspects of applications performance.
We have been quite excited with the latest version of grafana, which now provides alerting engine, which we can set up alert rules on the statistics that we collect all over.
Read Alerting in grafana →
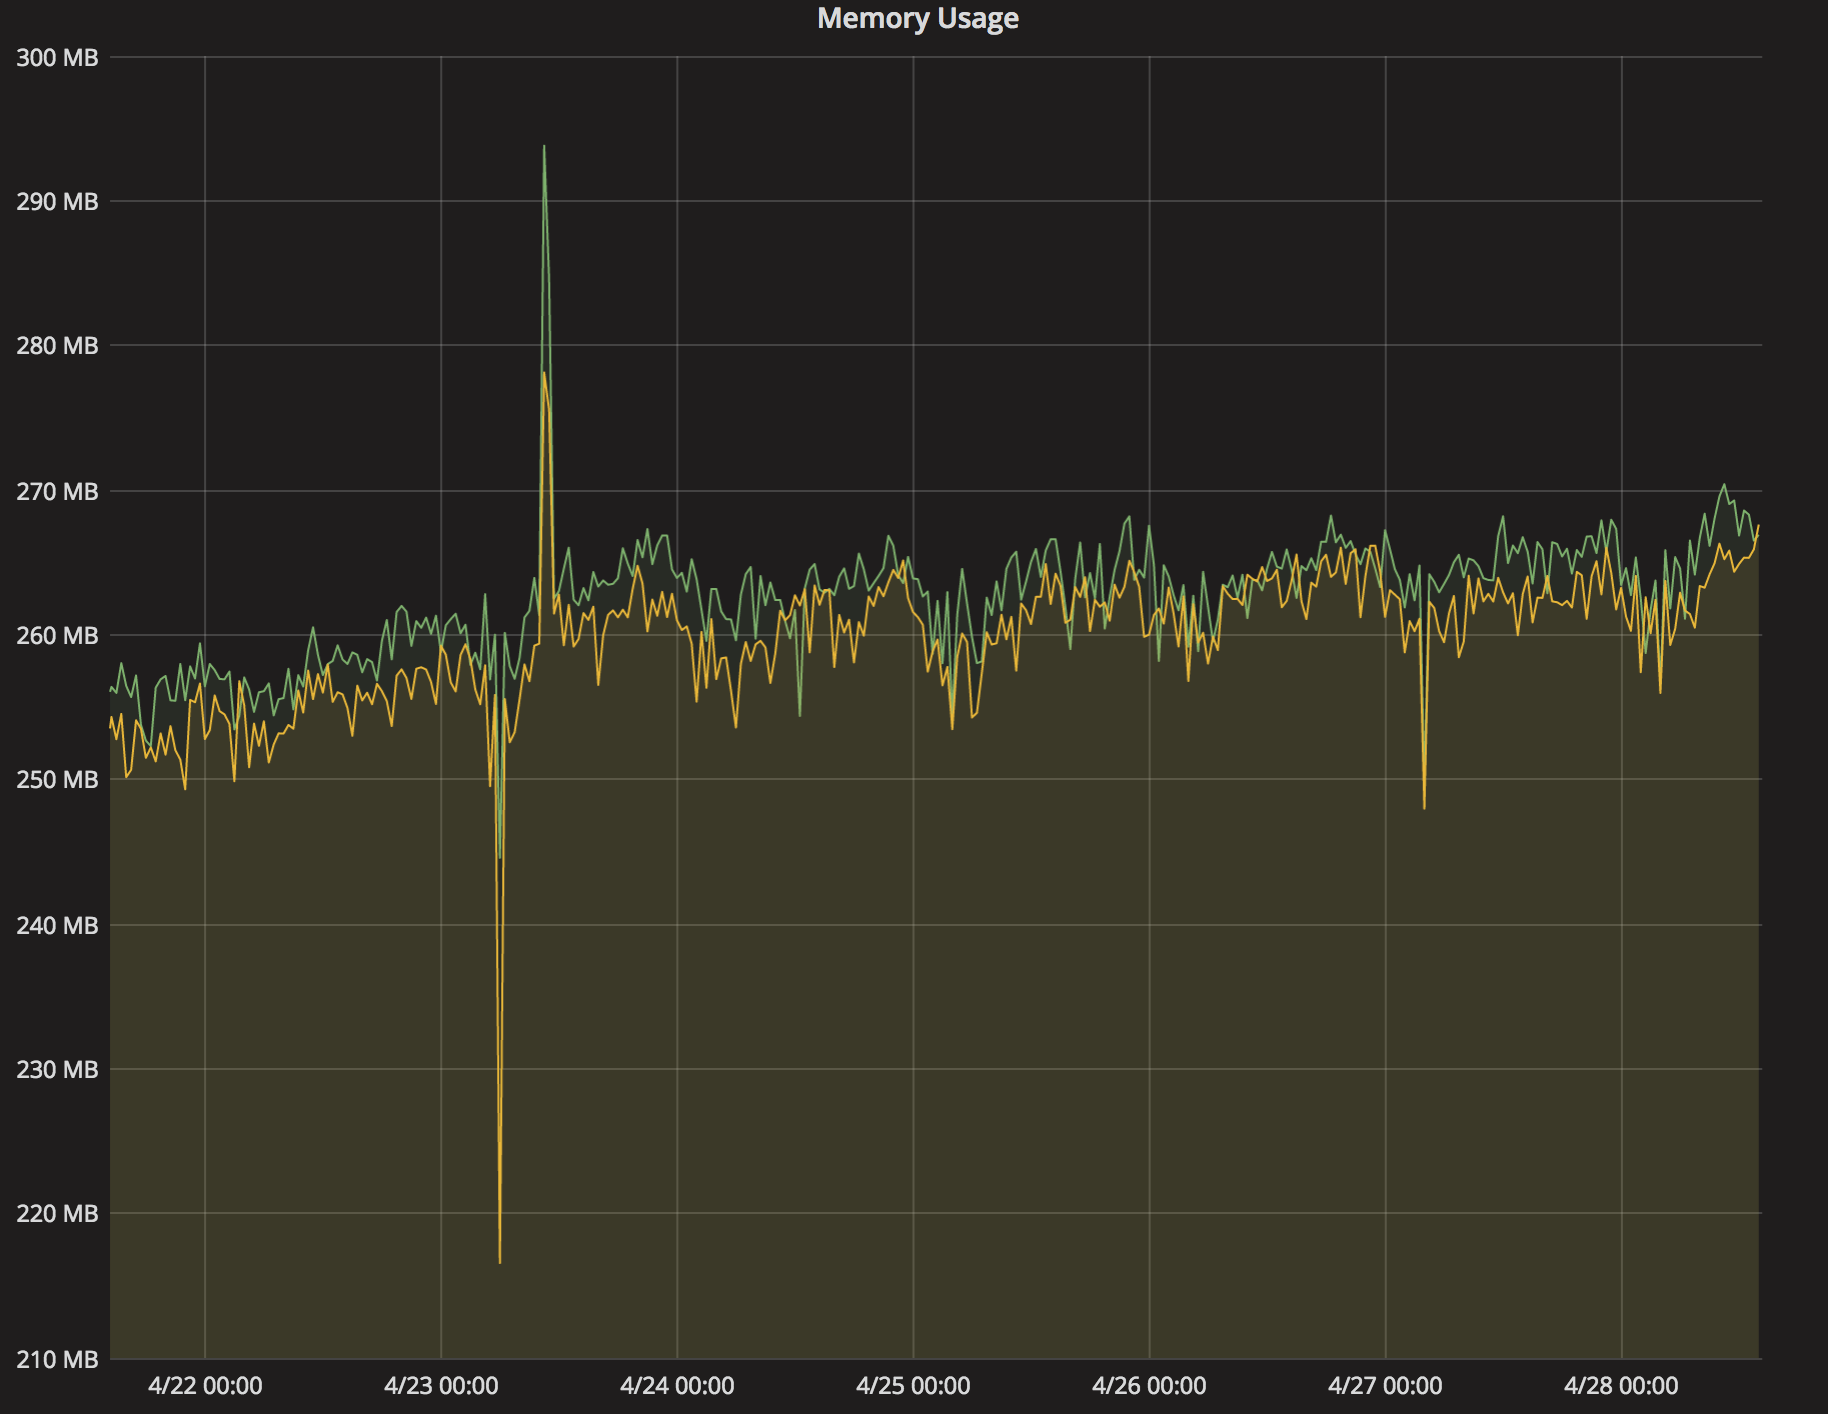
As a part of creating a new application that has strict performance requirements and needs to deal with large files, one of the teams working on mybring wanted a tool to investigate how much memory their JVM was using. It’s easy to see how much memory a process is allocating on a Linux system, but it’s more difficult to find out how much of the allocated memory that it is actually using. The JVM likes to allocate up to its maximum heap size very aggressively, but it might take a long time for it to actually use all that memory.
Read Measuring jvm stats →
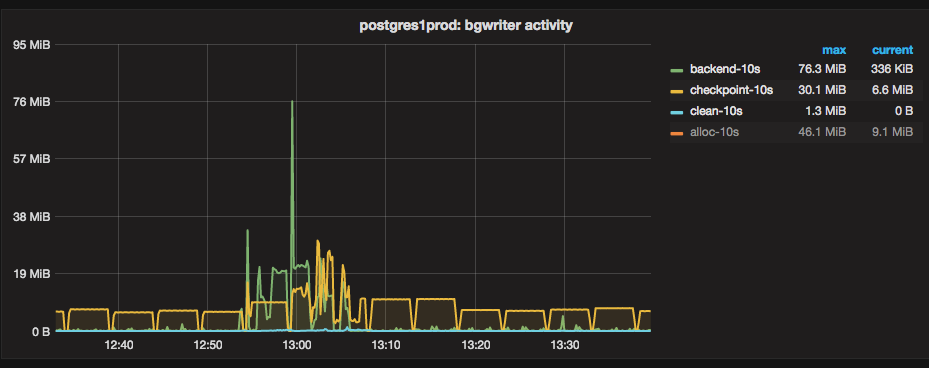
Back and writing about postgres again! Turns out it’s hard to go one week without discovering something new and interesting about postgres. Performance tuning has been an uncharted territory for us till now, we have done minor tweaks here and there but never dove into it head first. Recently we have encountered certain slow inserts and as a part of investigating those, we discovered that running postgres with default settings for checkpoints can lead to spiky I/O. Namely xlog triggered checkpoints may force a timed checkpoint to complete very quickly, leading to bursty writes. With log_checkpoints = on in your settings, a normal, time-triggered checkpoint will look like this:
Read Checking out checkpoints →
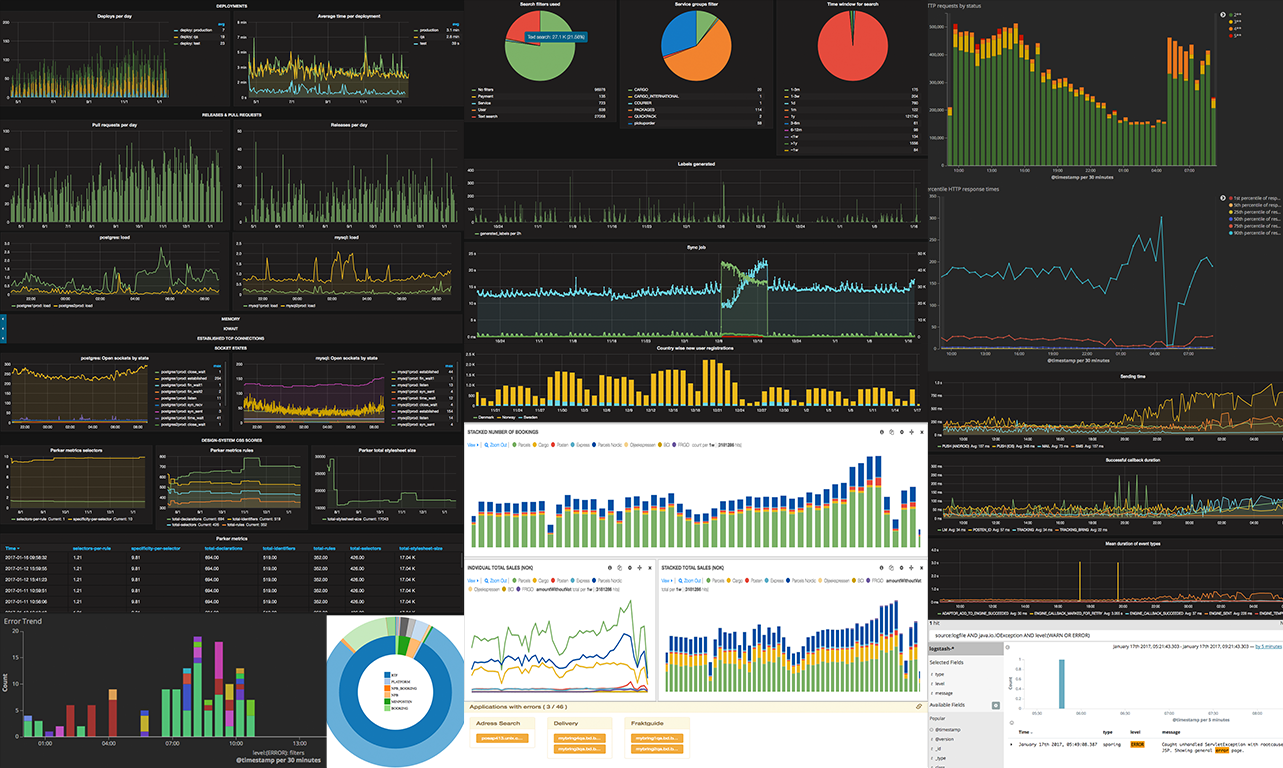
At Mybring, we collect a lot of metrics and we think they are incredibly useful and can be a lot of fun. At the end of the day, it’s essential to understand our systems and users. Collecting metrics enables us to take informed decisions - which are based on facts and numbers rather than speculations. We get an overview of the health of our servers, changes in system behaviour are reported over a period of time, which helps us in discovering problems before they happen.
Read Metrics at Mybring →

Back and blogging about postgres again! We do other things too, it’s just that postgres is a really cool product that we’ve had time to learn a lot about recently and it’s interesting to write about.
When we configured postgres, we set up logging for slow queries, but we set a really high log_min_duration_statement, going for 60 seconds. We’ve been running with that configuration ever since, but we’ve decided that 60 seconds is way too high to be useful, since nothing should ever trigger that. We’ve been wanting to lower it so we can be better at keeping track of slow queries. The first step you’re probably going to do when optimizing a query is to find the query plan that was executed.
Read Postgres auto_explain thresholds →
Postgres has a great multiversion concurrency control implementation (MVCC). MVCC a very useful concept, which allows you to do things like roll back transactions that do DDL changes. The goal is to allow for consistent point in time views of the database, while still allowing multiple transactions to read and write the database at the same time – without having to use expensive locks.
Read You should vacuum your databases →

We use client-side connection pools in our applications, in order to ensure that incoming requests can quickly get a database connection. This way, users don’t have to wait for the application to do a potentially expensive handshake with the database during their request. Most of our applications are Java applications, and we use a mix of HikariCP and c3p0 pools. We’re probably moving in the direction of using HikariCP everywhere, as it seems easier for us to tune.
Read Tuning postgres connection pools →

What does your backup do, Sam? We have been working on our postgres backup routines lately and spent a lot of time convincing ourselves that we have a working setup. This actually took a considerable amount of time, because we had a lot of skepticism after our recent firedrills. We think that skepticism is probably the healthy approach to backup routines anyway. Most people know that backups are important, but putting a lot of work into it has given us reasons to think about what problems that backups solve.
Read What does your backup do, Sam? →
In January 2016, we set up a postgres cluster at bring. While doing the initial configuration, we designed what we thought was a pretty decent backup architecture and we set up streaming replication to a hot standby. While configuring the cluster, we made sure to verify our ability to recover from backup, as well as our ability to fail over from the master server to the standby server. This gives us redundancy in case of outages or patching, and it gives us recoverability in case of data corruption, or so we thought. We documented the procedures and all was well. At this point our postgres installation was on 9.4, and we upgraded that to 9.5 to get some new features before we really started using it.
Read The value of firedrills →