Measuring jvm stats
As a part of creating a new application that has strict performance requirements and needs to deal with large files, one of the teams working on mybring wanted a tool to investigate how much memory their JVM was using. It’s easy to see how much memory a process is allocating on a Linux system, but it’s more difficult to find out how much of the allocated memory that it is actually using. The JVM likes to allocate up to its maximum heap size very aggressively, but it might take a long time for it to actually use all that memory.
There are some tools you can use to connect to a running JVM to inspect this, but for applications with these requirements, historical data is going to be very interesting. Previously, we’ve used tools like Java Melody to get information like this. Java Melody is a good tool, but it has some disadvantages. To use it in every JVM application we have, we would need to add code to all of them somehow. Also, for the metric type of data, we prefer to use Grafana which we’ve previously blogged about here. We don’t know if it’s possible to retrieve the data from Java Melody into Grafana.
We already had telegraf running on all our servers. It collects system information, such as free memory, load averages, cpu utilization every 10 seconds, and it seemed natural that we could leverage that to do something similar for JVM metrics. As it turns out, recent versions of telegraf has a very cool plugin for a tool called Jolokia, which is an agent that you can use with the JVM to get an HTTP-interface where you can perform JMX queries. You can use JMX queries to answer questions such as “How much memory is in the heap now?” or “How many threads are there?” – which is exactly what we needed.
Since all of our applications are set up and configured with configuration management, it seemed that going for this approach we could make a one-time effort to get this sort of monitoring for every JVM application we run. We used puppet to add the Jolokia agent to our servers and to add a startup parameter to a couple of our applications to activate it. After that, we added configuration to telegraf to make it perform some interesting JMX queries every time it runsf. We used a template that looks a lot like this:
# Read JMX metrics through Jolokia
[[inputs.jolokia]]
## This is the context root used to compose the jolokia url
## NOTE that Jolokia requires a trailing slash at the end of the context root
context = "/jolokia/"
## List of servers exposing jolokia read service
[[inputs.jolokia.servers]]
name = "<%= @name %>"
host = "127.0.0.1"
port = "<%= @port %>"
[[inputs.jolokia.metrics]]
name = "heap_memory_usage"
mbean = "java.lang:type=Memory"
attribute = "HeapMemoryUsage"
Puppet will put one configuration file for each application into /etc/telegraf/telegraf.d for us. Since telegraf runs on the same server as the applications, it can reach Jolokia on the loopback interface, which means we do not have to expose JMX on an external IP address.
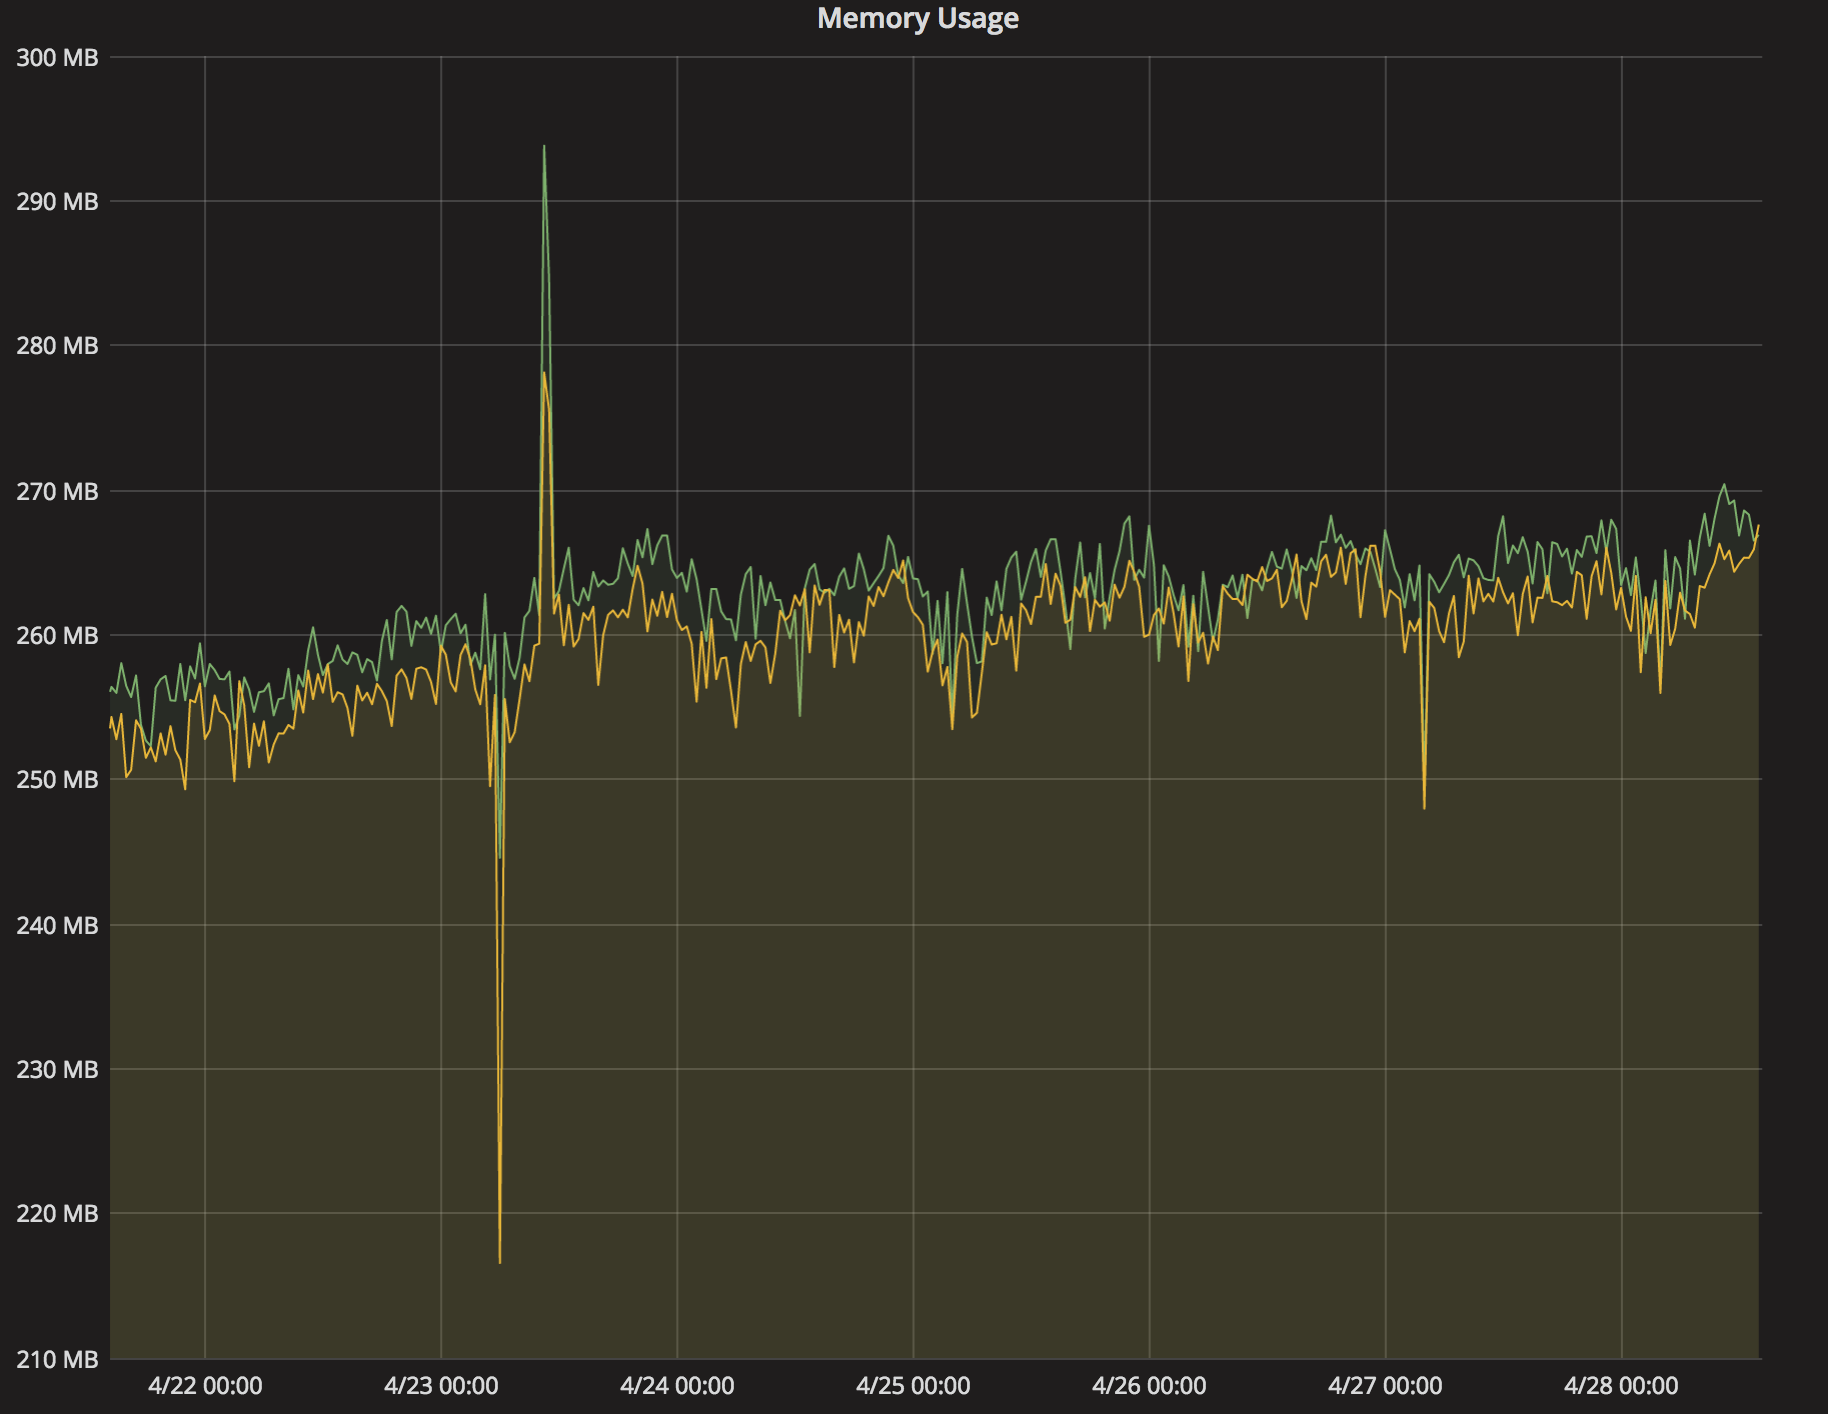
After testing with a couple of applications and getting some visualization up and running, we decided that it was working well and we activated this puppet configuration for most of our applications. The nice thing for us is that we got this monitoring working for all of our applications for pretty much the same amount of work as doing it for a single one.
It’s easy to add more JMX queries to the configuration files, other data that we’ll collect is connection pool data, threads, non-heap memory usage and the amount of loaded classes. One scenario where this will be very useful is when we have a memory leak and want to figure out which change that caused it, or when we run out of Compressed Class Space and want to figure out which change that caused us to start leaking classloaders.
Additionally, the latest version of Grafana lets us set up alerting based on thresholds on the data we collect, which seems like something we’ll end up using. All in all, we’re very happy with the telegraf, InfluxDB and Grafana stack which makes it really easy to add new monitoring to our systems.