It has been more than a year we started using Sentry.io to identify the user experience and UI failures one year ago. I thought of sharing What have we learnt about it so far and our experience with it.
📄 Intro 🏊♀️ Why do you need Sentry? Sign In and create a project Integrate Sentry in app First error tracking Use Sentry with API Endpoint When and what to log in Sentry Why do you need Sentry?
Read Experience with Frontend Error Tracking Using Sentry.io In React Apps →
There’s a saying that goes “an ounce of prevention is worth a pound of cure”. As a software developer, I definitely prefer being able to anticipate and prevent problems rather than stressfully fixing broken systems. Frequently when something in a computer goes haywire, it’s because it ran out of something important, like database connections, disk space, inodes, file descriptors or kernel magicians.
Read Forecasted alerts with Grafana and InfluxDB →
As mentioned in our previous blog, We at bring, use influx and grafana extensively, as one of the monitoring tools to collect statistics and visualize different aspects of applications performance.
We have been quite excited with the latest version of grafana, which now provides alerting engine, which we can set up alert rules on the statistics that we collect all over.
Read Alerting in grafana →

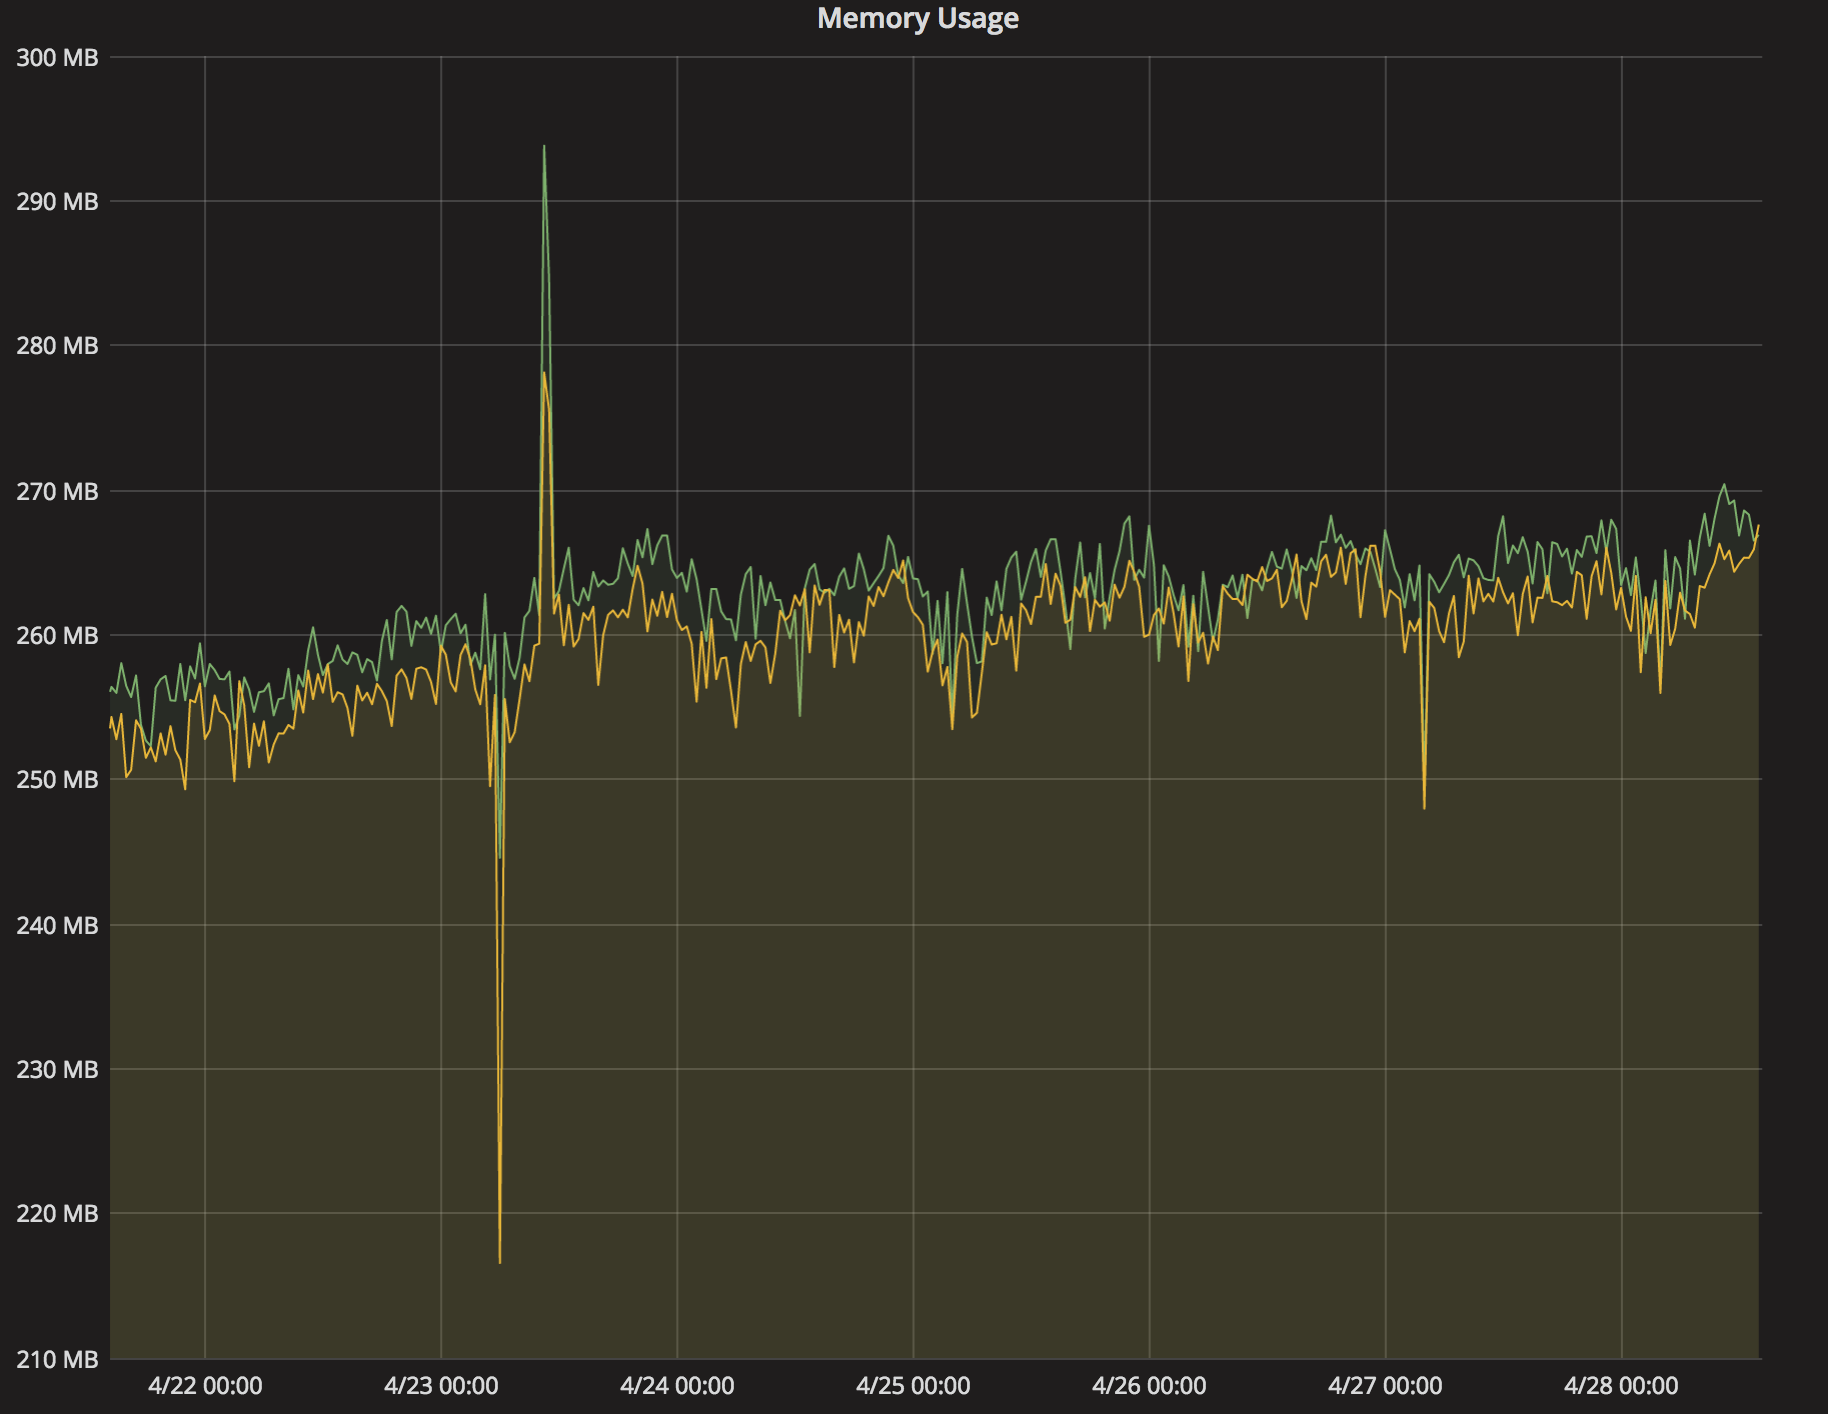
As a part of creating a new application that has strict performance requirements and needs to deal with large files, one of the teams working on mybring wanted a tool to investigate how much memory their JVM was using. It’s easy to see how much memory a process is allocating on a Linux system, but it’s more difficult to find out how much of the allocated memory that it is actually using.
Read Measuring jvm stats →
