Connection Pooling with c3p0
We at Bring have been using c3p0 in several of our applications, over the past years. Recently we faced an issue where we started to see lots of CannotGetJdbcConnectionException errors. The underlying database is MySQL for reference.
We thought that the issues were related to a migration to a new data center at first, but we ruled that out once we checked out that there were not enough slow queries to back this claim.
Stacktrace:
org.springframework.jdbc.CannotGetJdbcConnectionException: Could not get JDBC Connection; nested exception is java.sql.SQLException: An attempt by a client to checkout a Connection has timed out.
at org.springframework.jdbc.datasource.DataSourceUtils.getConnection(DataSourceUtils.java:80)
	at org.springframework.jdbc.core.JdbcTemplate.execute(JdbcTemplate.java:628)
	at org.springframework.jdbc.core.JdbcTemplate.query(JdbcTemplate.java:693)
	at org.springframework.jdbc.core.JdbcTemplate.query(JdbcTemplate.java:725)
	at org.springframework.jdbc.core.JdbcTemplate.query(JdbcTemplate.java:735)
	at org.springframework.jdbc.core.JdbcTemplate.query(JdbcTemplate.java:790)
Caused by: java.sql.SQLException: An attempt by a client to checkout a Connection has timed out.
	at com.mchange.v2.sql.SqlUtils.toSQLException(SqlUtils.java:118)
	at com.mchange.v2.sql.SqlUtils.toSQLException(SqlUtils.java:77)
	at com.mchange.v2.c3p0.impl.C3P0PooledConnectionPool.checkoutPooledConnection(C3P0PooledConnectionPool.java:690)
	at com.mchange.v2.c3p0.impl.AbstractPoolBackedDataSource.getConnection(AbstractPoolBackedDataSource.java:140)
	at sun.reflect.GeneratedMethodAccessor93.invoke(Unknown Source)
	at sun.reflect.DelegatingMethodAccessorImpl.invoke(DelegatingMethodAccessorImpl.java:43)
	at java.lang.reflect.Method.invoke(Method.java:497)
	at net.bull.javamelody.JdbcWrapper$3.invoke(JdbcWrapper.java:765)
	at net.bull.javamelody.JdbcWrapper$DelegatingInvocationHandler.invoke(JdbcWrapper.java:285)
	at com.sun.proxy.$Proxy52.getConnection(Unknown Source)
	at org.springframework.jdbc.datasource.DataSourceUtils.doGetConnection(DataSourceUtils.java:111)
	at org.springframework.jdbc.datasource.DataSourceUtils.getConnection(DataSourceUtils.java:77)
	... 99 more
Caused by: com.mchange.v2.resourcepool.TimeoutException: A client timed out while waiting to acquire a resource from com.mchange.v2.resourcepool.BasicResourcePool@7d3c22a5 -- timeout at awaitAvailable()
	at com.mchange.v2.resourcepool.BasicResourcePool.awaitAvailable(BasicResourcePool.java:1467)
	at com.mchange.v2.resourcepool.BasicResourcePool.prelimCheckoutResource(BasicResourcePool.java:644)
	at com.mchange.v2.resourcepool.BasicResourcePool.checkoutResource(BasicResourcePool.java:554)
	at com.mchange.v2.c3p0.impl.C3P0PooledConnectionPool.checkoutAndMarkConnectionInUse(C3P0PooledConnectionPool.java:758)
	at com.mchange.v2.c3p0.impl.C3P0PooledConnectionPool.checkoutPooledConnection(C3P0PooledConnectionPool.java:685)
	... 108 more
Upon digging in further we found that:
- There are not enough slow queries in the database to explain these errors.
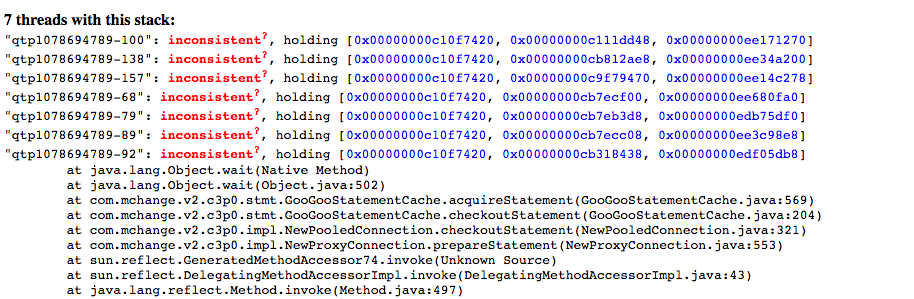
- The threaddumps for this application are weird. Lots of threads stuck waiting on something called GooGooStatementCache in c3p0.
- Heapdump reveals several hundreds of NewPreparedStatement from c3p0.
- The application logs contain lots and lots of “APPARENT DEADLOCK” WARN-entries from c3p0, indicating that the problem comes from the connection pool library, not mysql.
Further on analysing the application logs, which looked something like this:
WARN  [c.ThreadPoolAsynchronousRunner] [user:] - com.mchange.v2.async.ThreadPoolAsynchronousRunner$DeadlockDetector@15046d35 -- APPARENT DEADLOCK!!! Creating emergency threads for unassigned pending tasks!
WARN  [c.ThreadPoolAsynchronousRunner] [user:] - com.mchange.v2.async.ThreadPoolAsynchronousRunner$DeadlockDetector@15046d35 -- APPARENT DEADLOCK!!! Complete Status:
Some of those were CONNECTION TIMEOUT and APPARENT DEADLOCK WARN Errors which is how we identified it was a c3p0 issue. Then we found more details about this on stack overflow. Reply from Steve Waldman, who developed c3p0 helped us solving this problem.
Looking at our configurations we found one property to be configured somewhat wrong. maxStatements in c3p0 was set to a higher value.
So we decided to set the maxStatements=0 which will disable the statement cache entirely and it won’t need to defer the close. Problem solved, isn’t it?
Yes it did, but what we saw after deploying this fix was quite fascinating. We set up a metric in Kibana to check the response time for this application. These are the graphs:
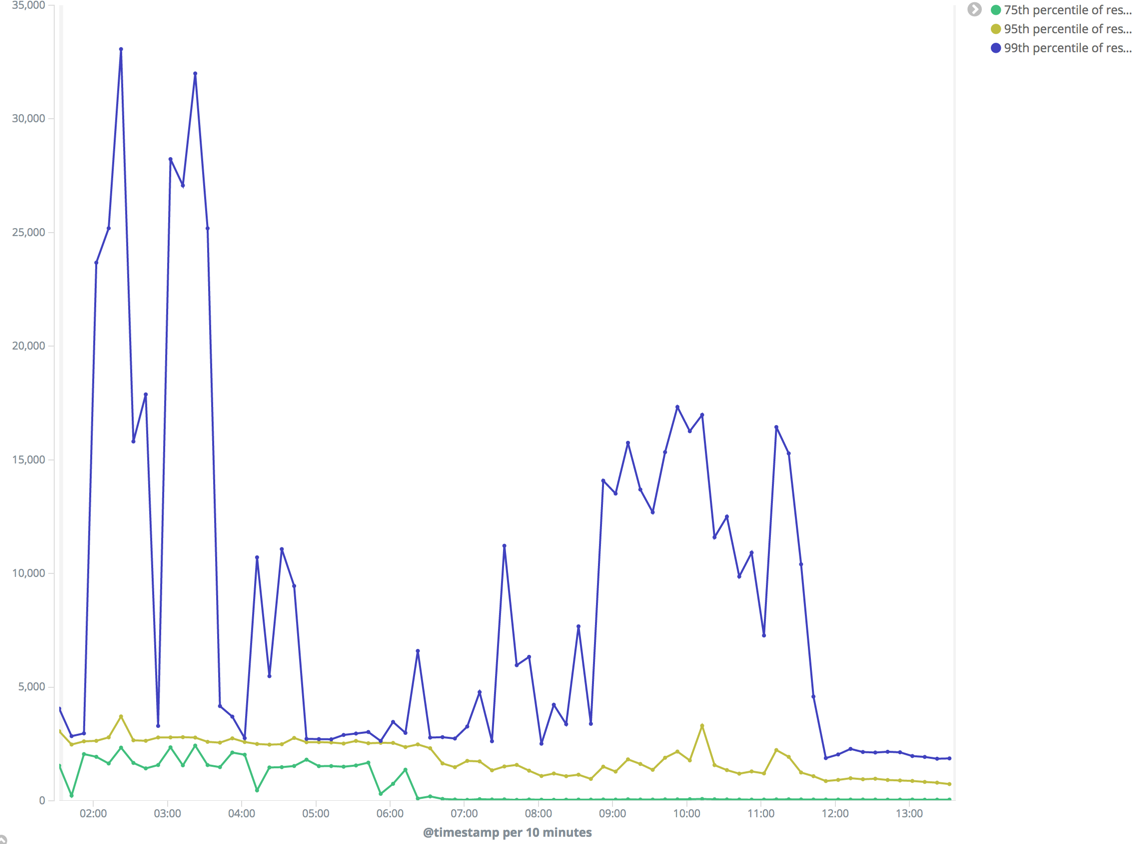
The response time here got reduced almost by a factor of 5. Last week, 90th percentile response time was ~900ms, now it’s 200ms. Quite Impressive. Hope this might help someone who has a similar problem.