Checking out checkpoints
Back and writing about postgres again! Turns out it’s hard to go one week without discovering something new and interesting about postgres. Performance tuning has been an uncharted territory for us till now, we have done minor tweaks here and there but never dove into it head first. Recently we have encountered certain slow inserts and as a part of investigating those, we discovered that running postgres with default settings for checkpoints can lead to spiky I/O. Namely xlog triggered checkpoints may force a timed checkpoint to complete very quickly, leading to bursty writes. With log_checkpoints = on in your settings, a normal, time-triggered checkpoint will look like this:
2017-03-14 18:26:36.196 CET db= user= remote_host= LOG: checkpoint starting: time
2017-03-14 18:30:59.757 CET db= user= remote_host= LOG: checkpoint complete:
wrote 20176 buffers (1.9%); 0 transaction log file(s) added, 0 removed, 10 recycled;
write=262.335 s, sync=1.202 s, total=263.560 s; sync files=416, longest=0.168 s,
average=0.002 s; distance=140722 kB, estimate=351122 kB
An xlog-trigged checkpoint, which you want to avoid, look like this:
2017-03-15 16:07:14.646 CET db= user= remote_host= LOG: checkpoint starting: xlog
2017-03-15 16:11:44.345 CET db= user= remote_host= LOG: checkpoint complete:
wrote 53503 buffers (5.1%); 0 transaction log file(s) added, 0 removed, 15 recycled;
write=269.294 s, sync=0.385 s, total=269.698 s; sync files=427, longest=0.099 s,
average=0.000 s; distance=400794 kB, estimate=400794 kB
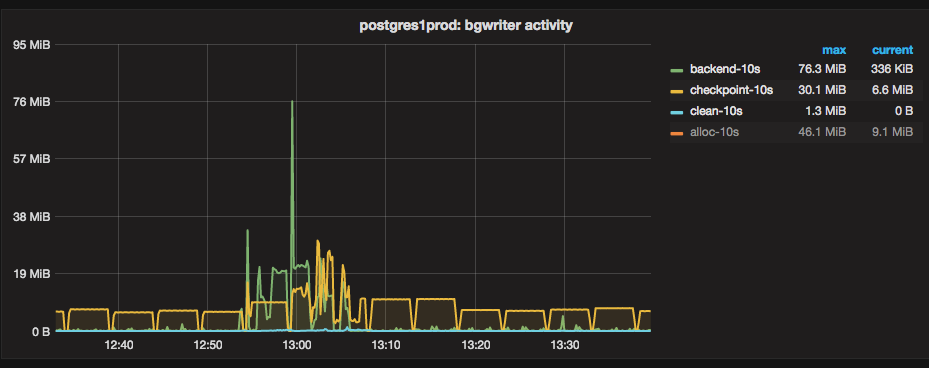
We have telegraf setup which reads pg_stat_bgwriter every 10 seconds, helping us immensely in locating the spiky checkpoint activities. The picture at the top of the blog post is a graph of the derivative of the values present in this view. The green line is the amount of buffers that had to be flushed by the client. The blue indicates the work done by the bgwriter and yellow represents the checkpointer process. Normally, you’d want the bgwriter to do more work than the clients.
Timings of the slow inserts coincided with spiky checkpoints and we also observed high I/O rate at these points in time. Therefore it seemed plausible that inserts were slow because of spiky checkpoints. Something you can do to make checkpoints less spiky is to increase checkpoint_timeout and max_wal_size. Following the advice from the blog post linked above, we conservatively increased the checkpoint timeout from the default of 5 minutes to 15 minutes and max_wal_size from the default of 1GB to 5GB. Furthermore we tried leverage the bgwriter to be more aggressive to avoid client connections flushing shared buffers. In postgres documentation, and in the pg_stat_bgwriter view, a client connection is referred to as a backend.
Everything postgres reads from disk has to be read into a shared buffer. If the shared buffer has been modified it is said to be dirty. Before reading into a dirty shared buffer it has to be cleaned, which is accomplished by flushing it to disk. This can be done by a client connection if there are no clean shared buffers available, or it can be done by the checkpointer or the bgwriter. It is preferable that the bgwriter does this rather than the clients, because no user is ever waiting on the bgwriter.
With the default settings the bgwriter will run up to 5 times in a second and is allowed to flush up to 100 pages each time it runs, with one page being 8192 bytes this means it can flush up to 4MB per second. In our database, this was dwarfed by the amount of flushing done by client connections. So, we doubled the frequency of the runs and doubled the max amount of pages to clean per run which allows the bgwriter to flush 16MB per second.
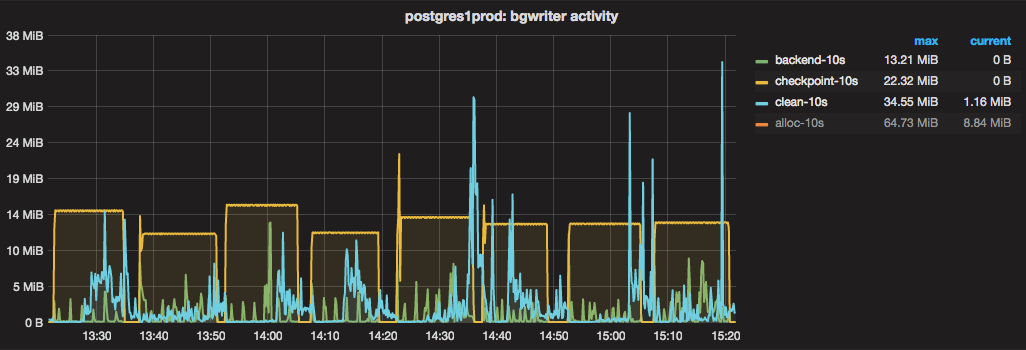
This graph shows the bgwriter being a lot more active and checkpointer being a lot more even, which is exactly what we hoped for. Note that the Y-axis on this graph stays below 40MB per 10 seconds. In the graph from before we tuned the bgwriter, the Y-axis goes to about 80MB because there’s a high spike in it.
Unfortunately this did not fix our slow inserts, even though our disk activities are now much more even. We no longer think that spiky disk I/O was the reason for the slow inserts. In hindsight this should have been obvious, as we were only observing the slow inserts on certain tables. If spiky I/O was the reason for that, we would have seen it affect other tables as well. Our new lead is the fact that all affected tables have gin indexes. We found some email threads discussing the performance implications of how gin fast update works. This is an interesting discussion of the trade off that the fast update does. It makes inserts faster on average, but occasionally a few inserts will be slow, if the autovacuumer has not cleaned the gin pending clean list. Our table does not get vacuumed often enough because its workload is mostly inserts. For now, the easiest fix seems to be to disable gin fast inserts or set up a frequent vacuuming scheme for the affected tables. We’ll be back with the results on some other Friday!